Sophus Capital Emerging Markets ETF (EMEM)
The Sophus Capital Emerging Markets ETF is a high conviction fund for investors seeking exposure to faster growth economies at compelling valuations. These markets tend to be under-owned and provide alternative exposure to overextended markets like the US. The experienced investment team actively manages risks to mitigate volatility.
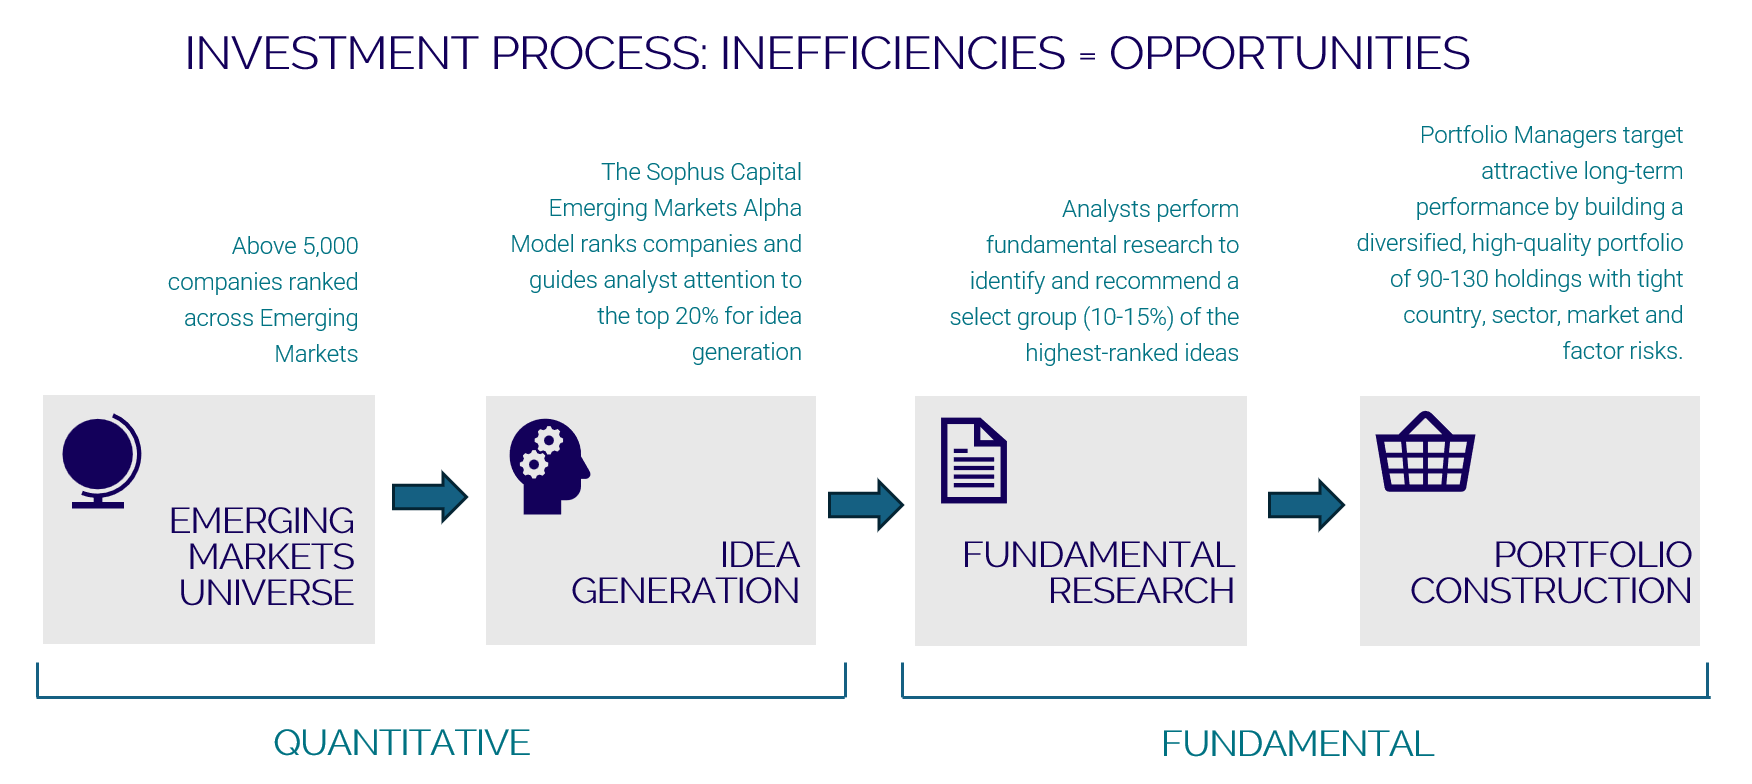
EMEM Methodology
Investment Philosophy
- The Sophus Capital emerging markets strategy is an actively managed, bottom-up strategy that aims to capture improving and sustainable earnings growth at attractive valuations, with earnings revision and positive surprise as catalysts for stock price appreciation.
- The team employs both fundamental analysis and quantitative screening to identify companies with above-average earnings growth relative to their peers.
Quantitative Analysis
- The team’s proprietary quantitative screening model, called the Sophus Capital Emerging Markets Alpha Model (“EM Alpha Model”), is a comparative framework that ranks above 4,000 companies across emerging markets. across emerging markets.
- The model ranks the stocks from 1 to 100 (most to least attractive) using screens developed by the team that focus on improving earnings growth at attractive valuations, with earnings revisions and potential for positive surprise as the catalysts for performance.
Fundamental Analysis
- Analysts focus fundamental, bottom-up research on companies that rank highly within the team’s quantitative screen, with particular emphasis placed on a company’s earnings growth, business strategy, value creation, competitive position, management quality, market position, and political and economic backdrop.
- The analysts interpret signals from the EM Alpha Model and combine them with in-depth fundamental research to formulate high conviction ideas.
- Fundamental research consists of rigorous evaluation of financial statements to gain insight into key drivers of company earnings, appraisal of a company’s growth prospects and its sustainability through meetings with management, industry contacts and analysis of industry data.
Risk Management
- Portfolio managers work closely with the analysts to determine buy and sell candidates, and overlay with disciplined risk management limiting broad country, regional and sector exposures to mitigate the volatility that individual emerging markets can exhibit.
Fund Details
| sort_order | ||
|---|---|---|
| 1 | Ticker | EMEM |
| 2 | Fund Type | Active |
| 3 | CUSIP | 26824D100 |
| 4 | Exchange | Nasdaq |
| 5 | Inception | 2026-05-19 |
| 6 | Net Assets | $58.18 million |
| 7 | Expense Ratio | 0.65% |
| 8 | 30-Day Bid/Ask Spread | 0.47% |
| 9 | As of Date | 2026-07-24 |
Fund Documents
NAV and Market Price
| Name | Last | 1-Day Change ($) | 1-Day Change (%) |
|---|---|---|---|
| NAV | $25.3 | $0.18 | 0.74% |
| Market Price | $25.01 | $-0.22 | -0.88% |
| Premium / Discount | -1.15% |
NAV is the sum of all assets less any liabilities, divided by the number of shares outstanding.
Month-End Performance
| Fund_Ticker | Type | YTD | 1 Month | 3 Month | 6 Month | 1 Year | 3 Year | 5 Year | 10 Year | Since Inception | As of Date | Inception Date |
|---|---|---|---|---|---|---|---|---|---|---|---|---|
| EMEM | MKT | 1.27 | 8.13 | 06/30/2026 | 05/19/2026 | |||||||
| EMEM | NAV | 0.40 | 7.11 | 06/30/2026 | 05/19/2026 |
Quarter-End Performance
| Fund_Ticker | Type | YTD | 1 Month | 3 Month | 6 Month | 1 Year | 3 Year | 5 Year | 10 Year | Since Inception | As of Date | Inception Date |
|---|---|---|---|---|---|---|---|---|---|---|---|---|
| EMEM | MKT | 1.27 | 8.13 | 06/30/2026 | 05/19/2026 | |||||||
| EMEM | NAV | 0.40 | 7.11 | 06/30/2026 | 05/19/2026 |
The fund’s inception date is May 19, 2026. The Fund is new and therefore does not have a performance history for a full calendar year as of the most recent quarter end. Returns are average annualized total returns, except those for periods of less than one year, which are cumulative.Performance quoted represents past performance and does not guarantee future results. Investment return and principal value will fluctuate so shares may be worth more or less when redeemed or sold. Current performance may be lower or higher than that quoted. Short term performance, in particular, is not a good indication of the fund’s future performance, and an investment should not be made based solely on returns.
Market Price Return is calculated using the price that investors buy and sell ETF shares in the market. The market returns in the table are based on the midpoint of the bid/ask spread at 4 p.m. EST and do not represent the returns you would receive if you traded shares at other times. NAV Return represents the closing price of underlying securities.
Historical Premium / Discount
The Premium/Discount shows the difference between the daily market price of the Fund’s shares and the Fund’s net asset value (“NAV”). The table shows the premium or discount of the mid-point price as a percentage of the NAV as well as the number of trading days the Fund traded within the given premium/discount range.
| As of Date | Premium/Discount (bps) |
|---|---|
| 2026-07-23 | -114.62 |
| 2026-07-22 | 47.79 |
| 2026-07-21 | 75.76 |
| 2026-07-20 | 24.53 |
| 2026-07-17 | -24.48 |
| 2026-07-16 | -111.6 |
| 2026-07-15 | -89.91 |
| 2026-07-14 | 155.81 |
| 2026-07-13 | 16.03 |
| 2026-07-10 | 62.21 |
| 2026-07-09 | 125.29 |
| 2026-07-08 | 82.29 |
| 2026-07-07 | -31.06 |
| 2026-07-06 | 45.37 |
| 2026-07-02 | -15.58 |
| 2026-07-01 | -57.43 |
| 2026-06-30 | 97.93 |
| 2026-06-29 | 53.6 |
| 2026-06-26 | 50.19 |
| 2026-06-25 | -63.98 |
| 2026-06-24 | -45.54 |
| 2026-06-23 | 45.99 |
| 2026-06-22 | 84.16 |
| 2026-06-18 | 84.25 |
| 2026-06-17 | -92.97 |
| 2026-06-16 | -55.99 |
| 2026-06-15 | 103.97 |
| 2026-06-12 | 76.25 |
| 2026-06-11 | 253.71 |
| 2026-06-10 | -74.77 |
| 2026-06-09 | -137.98 |
| 2026-06-08 | 130.33 |
| 2026-06-05 | -254.83 |
| 2026-06-04 | 29.9 |
| 2026-06-03 | 22.26 |
| 2026-06-02 | 80.79 |
| 2026-06-01 | 114.81 |
| 2026-05-29 | 7.56 |
| 2026-05-28 | 106.79 |
| 2026-05-27 | 15.11 |
| 2026-05-26 | 133.95 |
| 2026-05-22 | -11.75 |
| 2026-05-21 | 54.95 |
| 2026-05-20 | 156.31 |
| 2026-05-19 | 0 |
Fund Distributions
| Ex Date | Record Date | Payable Date | Income | Short Term Capital Gain | Long Term Capital Gain | Total Capital Gain | Total Distro |
|---|---|---|---|---|---|---|---|
Fund Holdings
| Ticker | Name | CUSIP | Shares | Price | Market Value ($mm) | % of Net Assets | EFFECTIVE_DATE |
|---|---|---|---|---|---|---|---|
| ASX | ASE Technology Holding Co Ltd | 00215W100 | 13,415 | 39.46 | 0.53 | 0.91 | 07/24/2026 |
| BABA | Alibaba Group Holding Ltd | 01609W102 | 2,070 | 114.06 | 0.24 | 0.41 | 07/24/2026 |
| GFNORTEO MM | Grupo Financiero Banorte SAB de CV | 55,200 | 189.00 | 0.60 | 1.02 | 07/24/2026 | |
| ALSEA* MM | Alsea SAB de CV | 127,880 | 40.00 | 0.29 | 0.50 | 07/24/2026 | |
| EMBJ | Embraer SA | 29082A107 | 8,970 | 65.47 | 0.59 | 1.01 | 07/24/2026 |
| FGXXX | First American Government Obligations Fund 12/01/2031 | 31846V336 | 675,267 | 100.00 | 0.68 | 1.16 | 07/24/2026 |
| ITUB | Itau Unibanco Holding SA | 465562106 | 106,030 | 8.35 | 0.89 | 1.52 | 07/24/2026 |
| ARVND IN | Arvind Ltd | 58,738 | 513.45 | 0.31 | 0.54 | 07/24/2026 | |
| VEDL IN | VEDANTA LTD | 99,876 | 264.60 | 0.27 | 0.47 | 07/24/2026 | |
| HZ IN | Hindustan Zinc Ltd | 50,694 | 531.15 | 0.28 | 0.48 | 07/24/2026 | |
| 005830 KS | DB Insurance Co Ltd | 3,304 | 165,400.00 | 0.37 | 0.64 | 07/24/2026 | |
| 1109 HK | China Resources Land Ltd | 120,750 | 34.00 | 0.52 | 0.90 | 07/24/2026 | |
| 857 HK | PetroChina Co Ltd | 309,580 | 10.11 | 0.40 | 0.69 | 07/24/2026 | |
| 2308 TT | Delta Electronics Inc | 15,706 | 1,880.00 | 0.91 | 1.57 | 07/24/2026 | |
| 2449 TT | King Yuan Electronics Co Ltd | 49,302 | 286.00 | 0.44 | 0.75 | 07/24/2026 | |
| 2454 TT | MediaTek Inc | 8,740 | 3,875.00 | 1.05 | 1.80 | 07/24/2026 | |
| 2600 HK | Aluminum Corp of China Ltd | 306,590 | 8.63 | 0.34 | 0.58 | 07/24/2026 | |
| 2884 TT | E.Sun Financial Holding Co Ltd | 369,380 | 35.65 | 0.41 | 0.70 | 07/24/2026 | |
| 000660 KS | SK hynix Inc | 1,840 | 1,919,000.00 | 2.41 | 4.14 | 07/24/2026 | |
| 000880 KS | Hanwha Corp | 4,830 | 94,700.00 | 0.31 | 0.54 | 07/24/2026 | |
| 3017 TT | Asia Vital Components Co Ltd | 8,616 | 2,440.00 | 0.65 | 1.12 | 07/24/2026 | |
| BMRI IJ | Bank Mandiri Persero Tbk PT | 2,090,930 | 4,380.00 | 0.51 | 0.88 | 07/24/2026 | |
| 2899 HK | Zijin Mining Group Co Ltd | 108,100 | 33.52 | 0.46 | 0.79 | 07/24/2026 | |
| TVSL IN | TVS Motor Co Ltd | 10,121 | 3,919.80 | 0.41 | 0.71 | 07/24/2026 | |
| 2338 HK | Weichai Power Co Ltd | 68,310 | 33.46 | 0.29 | 0.50 | 07/24/2026 | |
| 005930 KS | Samsung Electronics Co Ltd | 27,140 | 270,000.00 | 5.00 | 8.59 | 07/24/2026 | |
| 010140 KS | Samsung Heavy Industries Co Ltd | 17,940 | 23,650.00 | 0.29 | 0.50 | 07/24/2026 | |
| 004170 KS | Shinsegae Inc | 646 | 544,000.00 | 0.24 | 0.41 | 07/24/2026 | |
| TNB MK | Tenaga Nasional Bhd | 138,000 | 14.50 | 0.49 | 0.84 | 07/24/2026 | |
| 270 HK | Guangdong Investment Ltd | 289,800 | 8.27 | 0.31 | 0.53 | 07/24/2026 | |
| 2303 TT | United Microelectronics Corp | 153,037 | 138.50 | 0.66 | 1.13 | 07/24/2026 | |
| 2327 TT | Yageo Corp | 23,938 | 696.00 | 0.52 | 0.89 | 07/24/2026 | |
| LPP PW | LPP SA | 64 | 20,300.00 | 0.34 | 0.59 | 07/24/2026 | |
| PBR | Petroleo Brasileiro SA - Petrobras | 71654V408 | 44,850 | 19.00 | 0.85 | 1.46 | 07/24/2026 |
| PDD | PDD Holdings Inc | 722304102 | 6,670 | 83.30 | 0.56 | 0.95 | 07/24/2026 |
| SHG | Shinhan Financial Group Co Ltd | 824596100 | 7,719 | 71.65 | 0.55 | 0.95 | 07/24/2026 |
| TSM | Taiwan Semiconductor Manufacturing Co Ltd | 874039100 | 21,351 | 415.58 | 8.87 | 15.25 | 07/24/2026 |
| TCEHY | Tencent Holdings Ltd | 88032Q109 | 41,170 | 55.36 | 2.28 | 3.92 | 07/24/2026 |
| YUMC | Yum China Holdings Inc | 98850P109 | 9,890 | 43.11 | 0.43 | 0.73 | 07/24/2026 |
| BOMH IN | Bank of Maharashtra | 692,368 | 78.48 | 0.56 | 0.97 | 07/24/2026 | |
| 039490 KS | KIWOOM Securities Co Ltd | 1,150 | 314,500.00 | 0.25 | 0.42 | 07/24/2026 | |
| 2059 TT | King Slide Works Co Ltd | 2,113 | 8,200.00 | 0.54 | 0.92 | 07/24/2026 | |
| SBK SJ | Standard Bank Group Ltd | 22,080 | 314.22 | 0.41 | 0.71 | 07/24/2026 | |
| ASELS TI | Aselsan Elektronik Sanayi Ve Ticaret AS | 39,560 | 376.25 | 0.32 | 0.54 | 07/24/2026 | |
| GARAN TI | Turkiye Garanti Bankasi AS | 101,890 | 125.00 | 0.27 | 0.46 | 07/24/2026 | |
| BIMAS TI | BIM Birlesik Magazalar AS | 37,950 | 390.50 | 0.31 | 0.54 | 07/24/2026 | |
| RIBL AB | Riyad Bank | 109,020 | 21.08 | 0.61 | 1.05 | 07/24/2026 | |
| SAFCO AB | SABIC Agri-Nutrients Co | 8,970 | 122.70 | 0.29 | 0.50 | 07/24/2026 | |
| SECO AB | Saudi Energy Co | 70,610 | 17.83 | 0.34 | 0.58 | 07/24/2026 | |
| 3968 HK | China Merchants Bank Co Ltd | 138,460 | 48.52 | 0.86 | 1.47 | 07/24/2026 | |
| 3533 TT | Lotes Co Ltd | 7,360 | 2,035.00 | 0.46 | 0.80 | 07/24/2026 | |
| 3898 HK | Zhuzhou CRRC Times Electric Co Ltd | 66,972 | 33.88 | 0.29 | 0.50 | 07/24/2026 | |
| B1VK146 | Banco Pine SA | 103,730 | 13.18 | 0.27 | 0.46 | 07/24/2026 | |
| DLFU IN | DLF Ltd | 79,133 | 642.20 | 0.53 | 0.90 | 07/24/2026 | |
| FRES LN | Fresnillo PLC | 5,060 | 24.97 | 0.17 | 0.29 | 07/24/2026 | |
| ALINMA AB | Alinma Bank | 101,660 | 23.80 | 0.64 | 1.11 | 07/24/2026 | |
| MUTH IN | Muthoot Finance Ltd | 19,494 | 3,010.40 | 0.61 | 1.04 | 07/24/2026 | |
| 1378 HK | China Hongqiao Group Ltd | 87,170 | 23.94 | 0.27 | 0.46 | 07/24/2026 | |
| BAJAJCON IN | Bajaj Consumer Care Ltd | 49,786 | 555.90 | 0.29 | 0.49 | 07/24/2026 | |
| 1590 TT | Airtac International Group | 7,130 | 1,405.00 | 0.31 | 0.53 | 07/24/2026 | |
| 5536 TT | Acter Group Corp Ltd | 15,640 | 1,195.00 | 0.58 | 0.99 | 07/24/2026 | |
| 1336 HK | New China Life Insurance Co Ltd | 93,150 | 49.26 | 0.59 | 1.01 | 07/24/2026 | |
| 002170 C2 | Shenzhen Batian Ecotypic Engineering Co Ltd | 174,200 | 11.36 | 0.29 | 0.50 | 07/24/2026 | |
| 000001 C2 | Ping An Bank Co Ltd | 365,300 | 11.08 | 0.60 | 1.03 | 07/24/2026 | |
| 000933 C2 | Henan Shenhuo Coal Industry & Electricity Power Co Ltd | 69,800 | 26.26 | 0.27 | 0.47 | 07/24/2026 | |
| EMAARDEV UH | Emaar Development PJSC | 124,504 | 13.02 | 0.44 | 0.76 | 07/24/2026 | |
| 6669 TT | Wiwynn Corp | 4,304 | 5,470.00 | 0.73 | 1.25 | 07/24/2026 | |
| 002916 C2 | Shennan Circuits Co Ltd | 6,000 | 337.47 | 0.30 | 0.51 | 07/24/2026 | |
| 2359 HK | WuXi AppTec Co Ltd | 29,900 | 158.50 | 0.60 | 1.04 | 07/24/2026 | |
| POLYCAB IN | Polycab India Ltd | 3,300 | 8,935.00 | 0.31 | 0.52 | 07/24/2026 | |
| 300750 C2 | Contemporary Amperex Technology Co Ltd | 6,600 | 385.99 | 0.38 | 0.65 | 07/24/2026 | |
| GENTERA* MM | Gentera SAB de CV | 117,070 | 39.17 | 0.26 | 0.45 | 07/24/2026 | |
| 603606 C1 | Ningbo Orient Wires & Cables Co Ltd | 48,120 | 40.06 | 0.28 | 0.49 | 07/24/2026 | |
| OPTIMA GA | Optima bank SA | 26,350 | 10.00 | 0.30 | 0.52 | 07/24/2026 | |
| 2269 HK | Wuxi Biologics Cayman Inc | 77,454 | 39.24 | 0.39 | 0.67 | 07/24/2026 | |
| APTUS IN | Aptus Value Housing Finance India Ltd | 152,745 | 284.70 | 0.45 | 0.77 | 07/24/2026 | |
| 329180 KS | HD Hyundai Heavy Industries Co Ltd | 1,150 | 498,000.00 | 0.39 | 0.67 | 07/24/2026 | |
| CXSE3 BZ | Caixa Seguridade Participacoes S/A | 107,168 | 22.42 | 0.47 | 0.81 | 07/24/2026 | |
| 402340 KS | SK Square Co Ltd | 825 | 1,221,000.00 | 0.69 | 1.18 | 07/24/2026 | |
| 6031 HK | Sany Heavy Industry Co Ltd | 107,870 | 21.00 | 0.29 | 0.50 | 07/24/2026 | |
| FERTIGLB UH | Fertiglobe plc | 379,514 | 2.59 | 0.27 | 0.46 | 07/24/2026 | |
| 301345 C2 | Zhejiang Taotao Vehicles Co Ltd | 9,900 | 235.99 | 0.35 | 0.59 | 07/24/2026 | |
| 278470 KS | APR Corp/Korea | 920 | 370,000.00 | 0.23 | 0.40 | 07/24/2026 | |
| 601009 C1 | Bank of Nanjing Co Ltd | 240,900 | 11.24 | 0.40 | 0.69 | 07/24/2026 | |
| SCHFL IN | Schaeffler India Ltd | 7,441 | 4,093.20 | 0.32 | 0.54 | 07/24/2026 | |
| 688183 C1 | Shengyi Electronics Co Ltd | 18,400 | 100.66 | 0.27 | 0.47 | 07/24/2026 | |
| SHCR IN | Sharda Cropchem Ltd | 33,474 | 868.60 | 0.30 | 0.52 | 07/24/2026 | |
| 064400 KS | LG CNS Co Ltd | 6,629 | 69,900.00 | 0.32 | 0.54 | 07/24/2026 | |
| RRKABEL IN | RR Kabel Ltd | 12,974 | 2,378.30 | 0.32 | 0.55 | 07/24/2026 | |
| 443060 KS | HD Hyundai Marine Solution Co Ltd | 2,760 | 215,000.00 | 0.40 | 0.70 | 07/24/2026 | |
| SHFL IN | Shriram Finance Ltd | 66,900 | 1,025.80 | 0.71 | 1.22 | 07/24/2026 | |
| 2648 HK | Anjoy Foods Group Co Ltd | 44,160 | 73.95 | 0.42 | 0.72 | 07/24/2026 | |
| 3606 HK | Fuyao Glass Industry Group Co Ltd | 48,798 | 55.40 | 0.34 | 0.59 | 07/24/2026 | |
| 603806 C1 | Hangzhou First Applied Material Co Ltd | 145,400 | 14.38 | 0.31 | 0.53 | 07/24/2026 | |
| HRTA IJ | Hartadinata Abadi PT | 2,159,470 | 1,965.00 | 0.24 | 0.41 | 07/24/2026 | |
| BRL | BRAZILIAN REAL | 23,236 | 1.00 | 0.00 | 0.01 | 07/24/2026 | |
| CNY | CHINESE YUAN | 755,974 | 1.00 | 0.11 | 0.19 | 07/24/2026 | |
| EUR | EURO | 149 | 1.00 | 0.00 | 0.00 | 07/24/2026 | |
| HKD | HONG KONG DOLLAR | 56,887 | 1.00 | 0.01 | 0.01 | 07/24/2026 | |
| MXN | MEXICAN PESO | 446,875 | 1.00 | 0.03 | 0.04 | 07/24/2026 | |
| TWD | NEW TAIWAN DOLLAR | 128,974 | 1.00 | 0.00 | 0.01 | 07/24/2026 | |
| Cash&Other | Cash & Other | 125,304 | 1.00 | 0.13 | 0.22 | 07/24/2026 |
Fund holdings and allocations are subject to change at any time and should not be considered a recommendation to buy or sell any security.