Sophus Capital Emerging Markets Small Cap ETF (EMSC)
The Sophus Capital Emerging Small Cap Markets ETF is a high conviction fund for investors seeking more targeted exposure to smaller, dynamic companies in faster growth economies at compelling valuations. These stocks tend to be under-owned with higher pricing inefficiencies, providing broader investment at the sector and country levels and more exposure to local growth thematics. The experienced investment team actively manages risks to mitigate volatility.
EMSC Methodology
Investment Philosophy
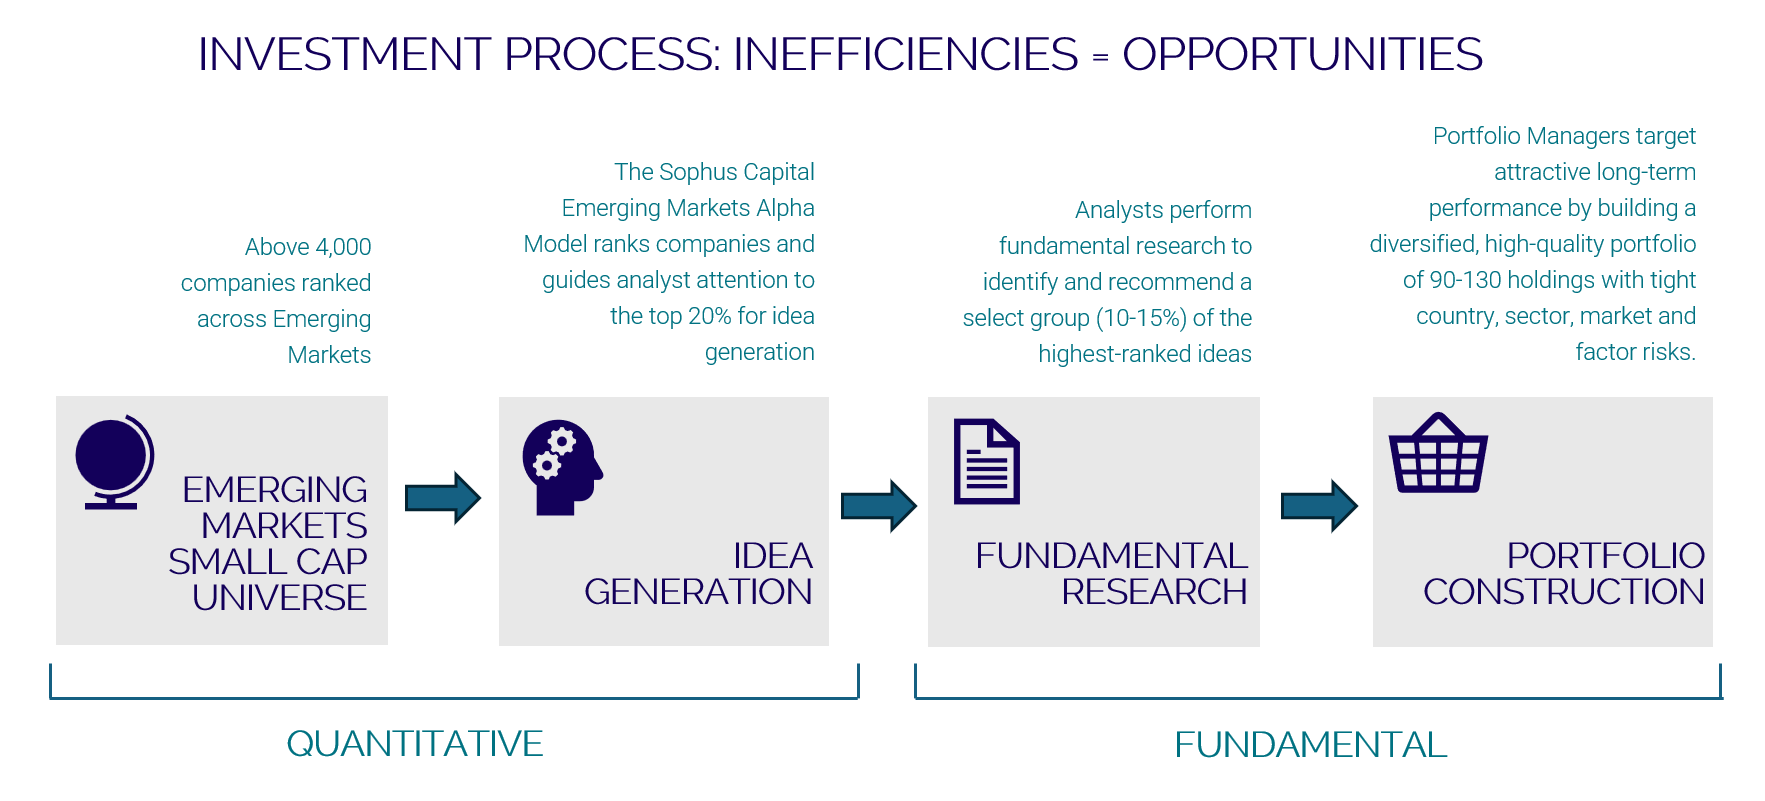
- The Sophus Capital emerging markets small cap strategy is an actively managed, bottom-up strategy that aims to capture improving and sustainable earnings growth at attractive valuations, with earnings revision and positive surprise as catalysts for stock price appreciation.
- The team employs both fundamental analysis and quantitative screening to identify companies with above-average earnings growth relative to their peers.
Quantitative Analysis
- The team’s proprietary quantitative screening model, called the Sophus Capital Emerging Markets Alpha Model (“EM Alpha Model”), is a comparative framework that ranks above 5,000 companies across emerging markets
- The model ranks the stocks from 1 to 100 (most to least attractive) using screens developed by the team that focus on improving earnings growth at attractive valuations, with earnings revisions and potential for positive surprise as the catalysts for performance.
Fundamental Analysis
- Analysts focus fundamental, bottom-up research on companies that rank highly within the team’s quantitative screen, with particular emphasis placed on a company’s earnings growth, business strategy, value creation, competitive position, management quality, market position, and political and economic backdrop.
- The analysts interpret signals from the EM Alpha Model and combine them with in-depth fundamental research to formulate high conviction ideas.
- Fundamental research consists of rigorous evaluation of financial statements to gain insight into key drivers of company earnings, appraisal of a company’s growth prospects and its sustainability through meetings with management, industry contacts and analysis of industry data.
Risk Management
- Portfolio managers work closely with the analysts to determine buy and sell candidates, and overlay with disciplined risk management limiting broad country, regional and sector exposures to mitigate the volatility that individual emerging markets can exhibit.
Fund Details
| sort_order | ||
|---|---|---|
| 1 | Ticker | EMSC |
| 2 | Fund Type | Active |
| 3 | CUSIP | 26824D209 |
| 4 | Exchange | Nasdaq |
| 5 | Inception | 2026-05-20 |
| 6 | Net Assets | $42.62 million |
| 7 | Expense Ratio | 0.85% |
| 8 | 30-Day Bid/Ask Spread | 0.38% |
| 9 | As of Date | 2026-07-24 |
Fund Documents
NAV and Market Price
| Name | Last | 1-Day Change ($) | 1-Day Change (%) |
|---|---|---|---|
| NAV | $24.78 | $0.07 | 0.27% |
| Market Price | $24.48 | $-0.63 | -2.49% |
| Premium / Discount | -1.21% |
NAV is the sum of all assets less any liabilities, divided by the number of shares outstanding.
Month-End Performance
| As of Date |
|---|
| 06/30/2026 |
| Fund_Ticker | Type | YTD | 1 Month | 3 Month | 6 Month | 1 Year | 3 Year | 5 Year | 10 Year | Since Inception | As of Date |
|---|---|---|---|---|---|---|---|---|---|---|---|
| EMSC | MKT | -2.44 | 4.67 | 06/30/2026 | |||||||
| EMSC | NAV | -3.02 | 3.40 | 06/30/2026 |
Quarter-End Performance
| As of Date |
|---|
| 06/30/2026 |
| Fund_Ticker | Type | YTD | 1 Month | 3 Month | 6 Month | 1 Year | 3 Year | 5 Year | 10 Year | Since Inception | As of Date |
|---|---|---|---|---|---|---|---|---|---|---|---|
| EMSC | MKT | -2.44 | 4.67 | 06/30/2026 | |||||||
| EMSC | NAV | -3.02 | 3.40 | 06/30/2026 |
The fund’s inception date is May 20, 2026. The Fund is new and therefore does not have a performance history for a full calendar year as of the most recent quarter end. Returns are average annualized total returns, except those for periods of less than one year, which are cumulative.Performance quoted represents past performance and does not guarantee future results. Investment return and principal value will fluctuate so shares may be worth more or less when redeemed or sold. Current performance may be lower or higher than that quoted. Short term performance, in particular, is not a good indication of the fund’s future performance, and an investment should not be made based solely on returns.
Market Price Return is calculated using the price that investors buy and sell ETF shares in the market. The market returns in the table are based on the midpoint of the bid/ask spread at 4 p.m. EST and do not represent the returns you would receive if you traded shares at other times. NAV Return represents the closing price of underlying securities.
Historical Premium / Discount
The Premium/Discount shows the difference between the daily market price of the Fund’s shares and the Fund’s net asset value (“NAV”). The table shows the premium or discount of the mid-point price as a percentage of the NAV as well as the number of trading days the Fund traded within the given premium/discount range.
| As of Date | Premium/Discount (bps) |
|---|---|
| 2026-05-20 | 0 |
| 2026-05-21 | 27.45 |
| 2026-05-22 | -11.61 |
| 2026-05-26 | 150.77 |
| 2026-05-27 | 18.81 |
| 2026-05-28 | 186.03 |
| 2026-05-29 | 63.67 |
| 2026-06-01 | 141.69 |
| 2026-06-02 | 97.74 |
| 2026-06-03 | 7.57 |
| 2026-06-04 | 45.27 |
| 2026-06-05 | -304.2 |
| 2026-06-08 | 135.3 |
| 2026-06-09 | -150.87 |
| 2026-06-10 | -55.36 |
| 2026-06-11 | 300.9 |
| 2026-06-12 | 95.06 |
| 2026-06-15 | 127.39 |
| 2026-06-16 | -82.99 |
| 2026-06-17 | -83.11 |
| 2026-06-18 | 94.16 |
| 2026-06-22 | 97.93 |
| 2026-06-23 | -54.24 |
| 2026-06-24 | -42.6 |
| 2026-06-25 | -34.71 |
| 2026-06-26 | 70.73 |
| 2026-06-29 | 93.24 |
| 2026-06-30 | 123.6 |
| 2026-07-01 | -46.51 |
| 2026-07-02 | -27.25 |
| 2026-07-06 | 61.8 |
| 2026-07-07 | -43.34 |
| 2026-07-08 | 91.74 |
| 2026-07-09 | 142.86 |
| 2026-07-10 | 101.8 |
| 2026-07-13 | -7.93 |
| 2026-07-14 | 156.5 |
| 2026-07-15 | -62.94 |
| 2026-07-16 | -118.86 |
| 2026-07-17 | 48.94 |
| 2026-07-20 | 102.97 |
| 2026-07-21 | 202.76 |
| 2026-07-22 | 157.83 |
| 2026-07-23 | -121.07 |
Fund Distributions
| Ex Date | Record Date | Payable Date | Income | Short Term Capital Gain | Long Term Capital Gain | Total Capital Gain | Total Distro |
|---|---|---|---|---|---|---|---|
Fund Holdings
| Ticker | Name | CUSIP | Shares | Price | Market Value ($mm) | % of Net Assets | EFFECTIVE_DATE |
|---|---|---|---|---|---|---|---|
| MINEROS CB | Mineros SA | 60,716 | 15,580.00 | 0.30 | 0.69 | 07/24/2026 | |
| PNVL3 BZ | Dimed S/A -Distribuidora De Medicamentos | 92,192 | 11.78 | 0.21 | 0.50 | 07/24/2026 | |
| PARAUCO CI | Parque Arauco SA | 72,928 | 3,948.90 | 0.30 | 0.71 | 07/24/2026 | |
| FGXXX | First American Government Obligations Fund 12/01/2031 | 31846V336 | 656,197 | 100.00 | 0.66 | 1.54 | 07/24/2026 |
| MOH GA | Motor Oil Hellas Corinth Refineries SA | 7,052 | 49.82 | 0.40 | 0.94 | 07/24/2026 | |
| AVI SJ | AVI Ltd | 46,440 | 90.66 | 0.25 | 0.59 | 07/24/2026 | |
| ARVND IN | Arvind Ltd | 66,024 | 513.45 | 0.35 | 0.82 | 07/24/2026 | |
| LICHF IN | LIC Housing Finance Ltd | 117,431 | 533.70 | 0.65 | 1.52 | 07/24/2026 | |
| 2404 TT | United Integrated Services Co Ltd | 10,836 | 1,165.00 | 0.39 | 0.92 | 07/24/2026 | |
| 2421 TT | Sunonwealth Electric Machine Industry Co Ltd | 52,460 | 133.50 | 0.22 | 0.51 | 07/24/2026 | |
| NACL IN | National Aluminium Co Ltd | 56,606 | 346.00 | 0.20 | 0.48 | 07/24/2026 | |
| 020000 KS | Handsome Co Ltd | 26,307 | 21,350.00 | 0.38 | 0.90 | 07/24/2026 | |
| 2501 TT | Cathay Real Estate Development Co Ltd | 921,920 | 22.65 | 0.65 | 1.52 | 07/24/2026 | |
| 1513 TT | Chung-Hsin Electric & Machinery Manufacturing Corp | 136,224 | 160.00 | 0.67 | 1.58 | 07/24/2026 | |
| OMN SJ | Omnia Holdings Ltd | 40,764 | 110.78 | 0.27 | 0.63 | 07/24/2026 | |
| 2313 TT | Compeq Manufacturing Co Ltd | 82,388 | 214.00 | 0.55 | 1.28 | 07/24/2026 | |
| UNTR IJ | United Tractors Tbk PT | 182,848 | 25,500.00 | 0.26 | 0.61 | 07/24/2026 | |
| 5434 TT | Topco Scientific Co Ltd | 26,529 | 559.00 | 0.46 | 1.08 | 07/24/2026 | |
| MEDC IJ | Medco Energi Internasional Tbk PT | 3,361,399 | 1,390.00 | 0.26 | 0.61 | 07/24/2026 | |
| ELEQ IN | Elgi Equipments Ltd | 106,751 | 586.05 | 0.65 | 1.52 | 07/24/2026 | |
| 007660 KS | IsuPetasys Co Ltd | 8,256 | 93,400.00 | 0.53 | 1.23 | 07/24/2026 | |
| 3036 TT | WT Microelectronics Co Ltd | 77,056 | 207.50 | 0.49 | 1.16 | 07/24/2026 | |
| 2441 TT | Greatek Electronics Inc | 100,732 | 127.00 | 0.40 | 0.93 | 07/24/2026 | |
| 3044 TT | Tripod Technology Corp | 25,972 | 406.00 | 0.33 | 0.77 | 07/24/2026 | |
| 3023 TT | Sinbon Electronics Co Ltd | 51,944 | 304.50 | 0.49 | 1.15 | 07/24/2026 | |
| ENGR IN | Engineers India Ltd | 101,168 | 224.25 | 0.23 | 0.55 | 07/24/2026 | |
| 000990 KS | DB HiTek Co Ltd | 2,924 | 110,100.00 | 0.22 | 0.51 | 07/24/2026 | |
| 1133 HK | Harbin Electric Co Ltd | 92,192 | 17.11 | 0.20 | 0.47 | 07/24/2026 | |
| 6139 TT | L&K Engineering Co Ltd | 17,112 | 858.00 | 0.45 | 1.07 | 07/24/2026 | |
| 000880 KS | Hanwha Corp | 3,096 | 94,700.00 | 0.20 | 0.47 | 07/24/2026 | |
| 005850 KS | SL Corp | 5,848 | 56,900.00 | 0.23 | 0.53 | 07/24/2026 | |
| 5904 TT | Poya International Co Ltd | 15,308 | 635.00 | 0.30 | 0.71 | 07/24/2026 | |
| SMELT MK | Malaysia Smelting Corp Bhd | 588,800 | 1.90 | 0.27 | 0.64 | 07/24/2026 | |
| ALLZ MK | Allianz Malaysia Bhd | 42,482 | 20.96 | 0.22 | 0.51 | 07/24/2026 | |
| 6239 TT | Powertech Technology Inc | 90,128 | 294.00 | 0.82 | 1.92 | 07/24/2026 | |
| NTC SJ | Netcare Ltd | 254,216 | 17.99 | 0.27 | 0.64 | 07/24/2026 | |
| 064760 KS | Tokai Carbon Korea Co Ltd | 1,376 | 199,600.00 | 0.19 | 0.44 | 07/24/2026 | |
| 8210 TT | Chenbro Micom Co Ltd | 6,708 | 1,180.00 | 0.24 | 0.57 | 07/24/2026 | |
| 8016 TT | Sitronix Technology Corp | 27,004 | 298.00 | 0.25 | 0.58 | 07/24/2026 | |
| 8299 TT | Phison Electronics Corp | 8,432 | 1,920.00 | 0.50 | 1.18 | 07/24/2026 | |
| 3264 TT | Ardentec Corp | 67,154 | 218.00 | 0.45 | 1.06 | 07/24/2026 | |
| 2006 TT | Tung Ho Steel Enterprise Corp | 157,208 | 71.20 | 0.35 | 0.81 | 07/24/2026 | |
| KPG MK | Kerjaya Prospek Group Bhd | 414,394 | 2.41 | 0.24 | 0.57 | 07/24/2026 | |
| 2344 TT | Winbond Electronics Corp | 144,824 | 161.00 | 0.72 | 1.69 | 07/24/2026 | |
| BOMH IN | Bank of Maharashtra | 252,522 | 78.48 | 0.21 | 0.48 | 07/24/2026 | |
| 039490 KS | KIWOOM Securities Co Ltd | 1,204 | 314,500.00 | 0.26 | 0.61 | 07/24/2026 | |
| ANHYT TI | Anadolu Hayat Emeklilik AS | 162,569 | 104.00 | 0.36 | 0.84 | 07/24/2026 | |
| MAPI IJ | Mitra Adiperkasa Tbk PT | 8,074,106 | 1,515.00 | 0.68 | 1.60 | 07/24/2026 | |
| MWC PM | Manila Water Co Inc | 372,326 | 35.10 | 0.21 | 0.50 | 07/24/2026 | |
| WLCO IN | Welspun Corp Ltd | 21,738 | 1,612.80 | 0.36 | 0.85 | 07/24/2026 | |
| PHNX IN | Phoenix Mills Ltd/The | 13,527 | 2,035.60 | 0.29 | 0.67 | 07/24/2026 | |
| FIEM IN | FIEM Industries Ltd | 9,334 | 2,314.10 | 0.22 | 0.52 | 07/24/2026 | |
| 1888 HK | Kingboard Laminates Holdings Ltd | 44,533 | 40.70 | 0.23 | 0.54 | 07/24/2026 | |
| B1VK146 | Banco Pine SA | 79,808 | 13.18 | 0.21 | 0.49 | 07/24/2026 | |
| MULT3 BZ | Multiplan Empreendimentos Imobiliarios SA | 45,752 | 28.41 | 0.26 | 0.60 | 07/24/2026 | |
| 3617 TT | CyberPower Systems Inc | 108,704 | 216.50 | 0.73 | 1.71 | 07/24/2026 | |
| 011070 KS | LG Innotek Co Ltd | 688 | 679,000.00 | 0.32 | 0.75 | 07/24/2026 | |
| 100120 KS | Vieworks Co Ltd | 20,858 | 23,200.00 | 0.33 | 0.77 | 07/24/2026 | |
| 8415 TT | Brighton-Best International Taiwan Inc | 329,197 | 37.75 | 0.38 | 0.90 | 07/24/2026 | |
| 3131 TT | Grand Process Technology Corp | 3,989 | 3,035.00 | 0.37 | 0.88 | 07/24/2026 | |
| BAJAJCON IN | Bajaj Consumer Care Ltd | 37,044 | 555.90 | 0.21 | 0.50 | 07/24/2026 | |
| BFT PW | Benefit Systems SA | 516 | 5,175.00 | 0.70 | 1.65 | 07/24/2026 | |
| MGROS TI | Migros Ticaret AS | 17,769 | 630.50 | 0.24 | 0.56 | 07/24/2026 | |
| 631 HK | Sany Heavy Equipment International Holdings Co Ltd | 196,080 | 7.67 | 0.19 | 0.45 | 07/24/2026 | |
| 5536 TT | Acter Group Corp Ltd | 9,804 | 1,195.00 | 0.36 | 0.85 | 07/24/2026 | |
| 111770 KS | Youngone Corp | 4,300 | 87,600.00 | 0.26 | 0.60 | 07/24/2026 | |
| SNT PW | Synektik SA | 2,924 | 363.00 | 0.28 | 0.65 | 07/24/2026 | |
| 175330 KS | JB Financial Group Co Ltd | 15,308 | 25,550.00 | 0.27 | 0.63 | 07/24/2026 | |
| RICHT HB | Richter Gedeon Nyrt | 5,504 | 11,650.00 | 0.20 | 0.47 | 07/24/2026 | |
| 6691 TT | Yankey Engineering Co Ltd | 12,728 | 730.00 | 0.29 | 0.67 | 07/24/2026 | |
| 002170 C2 | Shenzhen Batian Ecotypic Engineering Co Ltd | 120,400 | 11.36 | 0.20 | 0.47 | 07/24/2026 | |
| JMNA IN | Jamna Auto Industries Ltd | 197,635 | 130.80 | 0.27 | 0.63 | 07/24/2026 | |
| 002782 C2 | Shenzhen Click Technology Co Ltd | 51,600 | 14.45 | 0.11 | 0.26 | 07/24/2026 | |
| FFB SJ | Fortress Real Estate Investments Ltd | 428,624 | 23.82 | 0.61 | 1.42 | 07/24/2026 | |
| 271560 KS | Orion Corp/Republic of Korea | 5,504 | 129,300.00 | 0.49 | 1.14 | 07/24/2026 | |
| SAPR11 BZ | Cia De Saneamento do Parana Sanepar | 33,540 | 36.34 | 0.24 | 0.56 | 07/24/2026 | |
| NFIL IN | Navin Fluorine International Ltd | 8,847 | 7,673.50 | 0.70 | 1.65 | 07/24/2026 | |
| 1789 HK | AK Medical Holdings Ltd | 709,844 | 5.61 | 0.51 | 1.19 | 07/24/2026 | |
| 2678 HK | Texhong International Group Ltd | 253,184 | 6.77 | 0.22 | 0.51 | 07/24/2026 | |
| 1681 HK | Consun Pharmaceutical Group Ltd | 124,528 | 13.48 | 0.21 | 0.50 | 07/24/2026 | |
| GENTERA* MM | Gentera SAB de CV | 112,144 | 39.17 | 0.25 | 0.59 | 07/24/2026 | |
| TITC GA | Titan SA | 4,988 | 50.20 | 0.28 | 0.67 | 07/24/2026 | |
| CURY3 BZ | Cury Construtora e Incorporadora SA | 41,280 | 29.55 | 0.24 | 0.56 | 07/24/2026 | |
| 2400 HK | XD Inc | 83,592 | 42.84 | 0.46 | 1.07 | 07/24/2026 | |
| OPCT3 BZ | Oceanpact Servicos Maritimos SA | 110,424 | 11.06 | 0.24 | 0.56 | 07/24/2026 | |
| OPTIMA GA | Optima bank SA | 31,789 | 10.00 | 0.36 | 0.85 | 07/24/2026 | |
| APTUS IN | Aptus Value Housing Finance India Ltd | 243,501 | 284.70 | 0.72 | 1.68 | 07/24/2026 | |
| TABGD TI | TAB Gida Sanayi Ve Ticaret AS | 38,397 | 233.00 | 0.19 | 0.44 | 07/24/2026 | |
| 6805 TT | Fositek Corp | 11,524 | 1,455.00 | 0.52 | 1.22 | 07/24/2026 | |
| 2645 TT | Evergreen Aviation Technologies Corp | 92,955 | 198.00 | 0.57 | 1.34 | 07/24/2026 | |
| KLKIM TI | Kalekim Kimyevi Maddeler Sanayi ve Ticaret AS | 348,092 | 26.72 | 0.20 | 0.46 | 07/24/2026 | |
| MEDPLUS IN | Medplus Health Services Ltd | 25,864 | 715.20 | 0.19 | 0.45 | 07/24/2026 | |
| SJS IN | SJS Enterprises Ltd | 10,015 | 2,275.20 | 0.24 | 0.55 | 07/24/2026 | |
| FERTIGLB UH | Fertiglobe plc | 667,017 | 2.59 | 0.47 | 1.10 | 07/24/2026 | |
| 009900 KS | Myoung Shin Industrial Co Ltd | 31,648 | 7,080.00 | 0.15 | 0.36 | 07/24/2026 | |
| 340570 KS | T&L Co Ltd | 6,205 | 55,600.00 | 0.24 | 0.55 | 07/24/2026 | |
| RIAA3 BZ | GUARARAPES CONFECCOES SA | 128,828 | 7.96 | 0.20 | 0.47 | 07/24/2026 | |
| 688267 C1 | China Catalyst Holding Co Ltd | 60,180 | 16.41 | 0.15 | 0.34 | 07/24/2026 | |
| 195940 KS | HK inno N Corp | 21,500 | 38,800.00 | 0.57 | 1.33 | 07/24/2026 | |
| 688208 C1 | Autel Intelligent Technology Corp Ltd | 51,800 | 27.36 | 0.21 | 0.49 | 07/24/2026 | |
| 123 HK | Yuexiu Property Co Ltd | 1,146,552 | 3.69 | 0.54 | 1.27 | 07/24/2026 | |
| MNHLDG MK | MN Holdings Bhd | 349,600 | 2.95 | 0.25 | 0.59 | 07/24/2026 | |
| 403870 KS | HPSP Co Ltd | 10,866 | 39,650.00 | 0.29 | 0.69 | 07/24/2026 | |
| SCHFL IN | Schaeffler India Ltd | 5,429 | 4,093.20 | 0.23 | 0.54 | 07/24/2026 | |
| 6944 TT | Mega Union Technology Inc | 11,627 | 829.00 | 0.30 | 0.70 | 07/24/2026 | |
| SHCR IN | Sharda Cropchem Ltd | 71,860 | 868.60 | 0.65 | 1.52 | 07/24/2026 | |
| 064400 KS | LG CNS Co Ltd | 5,681 | 69,900.00 | 0.27 | 0.64 | 07/24/2026 | |
| RRKABEL IN | RR Kabel Ltd | 29,770 | 2,378.30 | 0.73 | 1.72 | 07/24/2026 | |
| EMCURE IN | Emcure Pharmaceuticals Ltd | 37,629 | 1,869.50 | 0.73 | 1.71 | 07/24/2026 | |
| INDIASHL IN | India Shelter Finance Corp Ltd | 86,427 | 746.50 | 0.67 | 1.57 | 07/24/2026 | |
| 2648 HK | Anjoy Foods Group Co Ltd | 20,984 | 73.95 | 0.20 | 0.46 | 07/24/2026 | |
| AJP IN | Ajanta Pharma Ltd | 8,139 | 3,439.90 | 0.29 | 0.68 | 07/24/2026 | |
| ECL CI | Engie Energia Chile SA | 118,680 | 1,830.00 | 0.23 | 0.54 | 07/24/2026 | |
| 6531 TT | AP Memory Technology Corp | 20,124 | 904.00 | 0.56 | 1.32 | 07/24/2026 | |
| SAUD3 BZ | Bradsaude S A | 87,892 | 14.90 | 0.26 | 0.60 | 07/24/2026 | |
| SCGB MK | Sunway Construction Group Bhd | 131,910 | 7.73 | 0.25 | 0.59 | 07/24/2026 | |
| BBAJIOO MM | Banco del Bajio SA | 87,548 | 56.65 | 0.28 | 0.66 | 07/24/2026 | |
| HRTA IJ | Hartadinata Abadi PT | 1,749,201 | 1,965.00 | 0.19 | 0.45 | 07/24/2026 | |
| BRL | BRAZILIAN REAL | 17,877 | 1.00 | 0.00 | 0.01 | 07/24/2026 | |
| CNY | CHINESE YUAN | 67,081 | 1.00 | 0.01 | 0.02 | 07/24/2026 | |
| EUR | EURO | 2,239 | 1.00 | 0.00 | 0.01 | 07/24/2026 | |
| HKD | HONG KONG DOLLAR | 196 | 1.00 | 0.00 | 0.00 | 07/24/2026 | |
| INR | INDIAN RUPEE | 12,008 | 1.00 | 0.00 | 0.00 | 07/24/2026 | |
| Cash&Other | Cash & Other | 147,883 | 1.00 | 0.15 | 0.35 | 07/24/2026 | |
| CYD | China Yuchai International Ltd | G21082105 | 4,644 | 45.84 | 0.21 | 0.50 | 07/24/2026 |
| BWMX | Betterware de Mexico SAPI de CV | P1666E105 | 13,416 | 17.31 | 0.23 | 0.54 | 07/24/2026 |
Fund holdings and allocations are subject to change at any time and should not be considered a recommendation to buy or sell any security.